Data For Humans
Data For Humans
Synthesize metrics using existing data to create metrics that heretofore didn't exist.

Explore Fascinating Data
Star Trek Fatalities by Shirt Color
Star Trek's "red shirt" trope is a funny, easily explored metric that we've taken the liberty of visualizing here . This demonstration is an expository embodiment of the different techniques that can be used to visualize & synthesize data, essentially of any type and of any source.
It's important to note that there are - so far - a couple different Star Trek models for recording Star Trek deaths by shirt color - since many of the deaths occurred off-screen, one model assumes the off-screen deaths are red shirts, another model assumes the shirt color of the offscreen deaths are "other" or "unidentified". You can choose from these two models using the drop-down button.
Head over to the Star Trek data page to check out the redshirt deaths visualizations, and be sure to share to social media!

Google Analytics Real-Time Dashboard

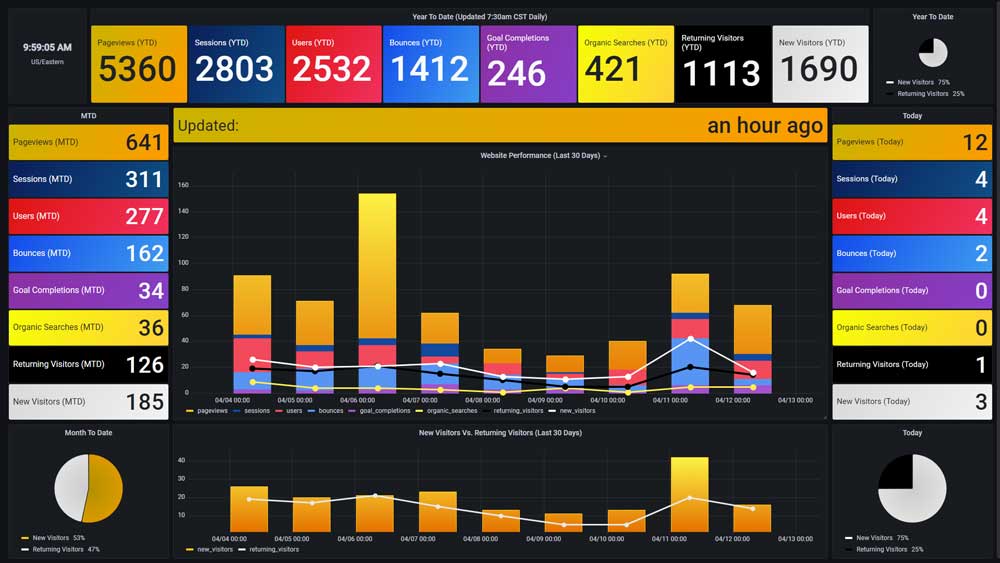
A critical dashboard when operating an online presence, the Google Analytics dashboard reveals and visualizes several important datapoints, extracted in real time from the branded Google Analtyics API. Showing metrics ranging from one year, one month, one day, and live, the Google Analytics dashboard allows users to make whiplash-quick decisions regarding marketing initiatives, active feedback processes and product direction.

Live WooCommerce Monitoring

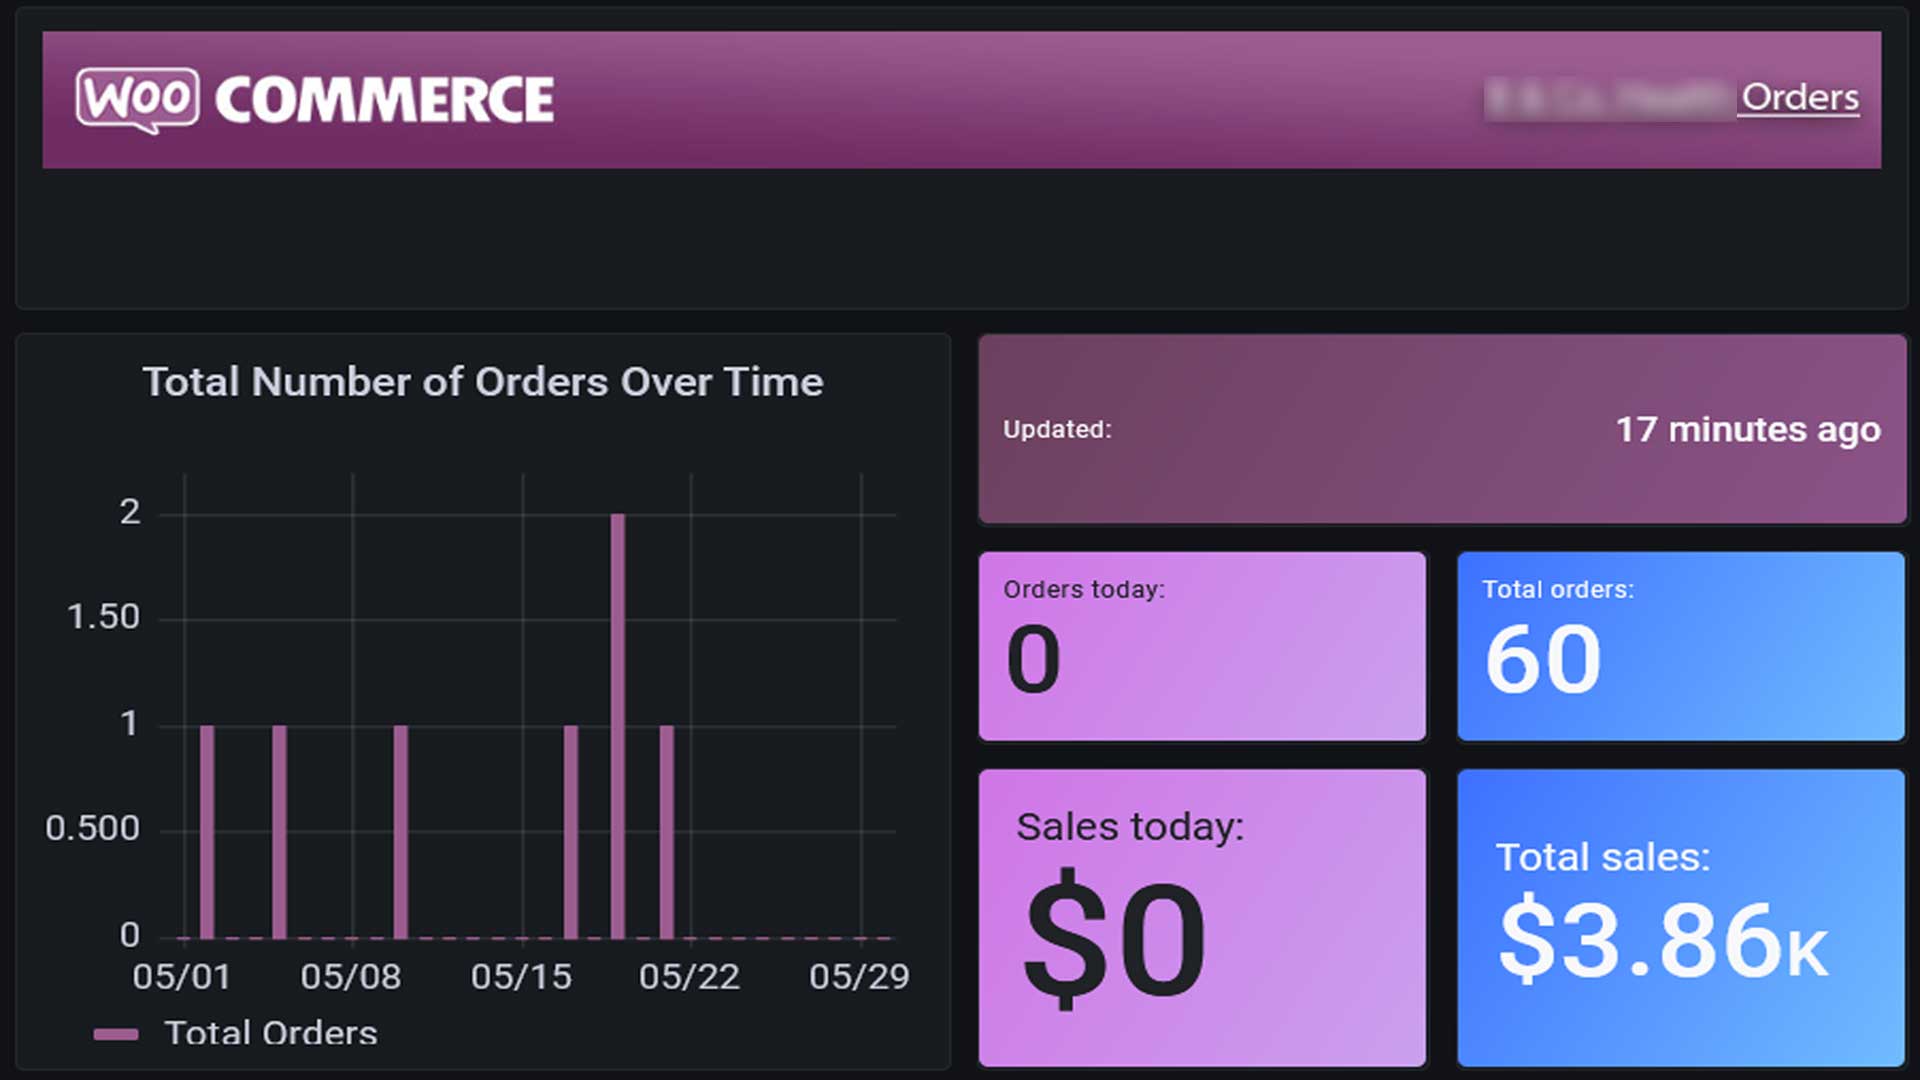
Recently, a client asked me if I was able to create a system that tracks purchases on their website in real time. After the Toaster story, obviously I responded in the affirmative. I gained access to their Wordpress, examined the WooCommerce plugin, and discovered that WooCommerce has a configurable API that can be ativated and secured via Basic authentication.
Once all of these elements were set up, I created an automated extractor that ran on a schedule (in the case every 5 minutes), dumped the WooCoomerce extracted API data into a cloud database, and then visualized the resultant data using Grafana.

Discover Data You Didn't Even Know You Had
"Metric Synthesis" is the process by which two or more metrics are evalutaed together to create a third as-yet-unknown metric. This process can gie insights into your data that aren't outright available from whatever object you're currently receving data.
Metric 1 + Metric 2 = Metric 3
Metric 1 - Metric 2 = Metric 3
Metric 1 * Metric 2 = Metric 3
Metric 1 / Metric 2 = Metric 3
And so on.
Needless to say, these metrics can be synthesized using more sophisticated evaluations, but for simplicity's sake I'm demonstrating metric synthesis using grade-school mathematics.

If it Exists, it can be Visualized
